A chromatictiy diagram is a two dimensional color gamut at a specific level of light. These calculations are at 100% light.
ppmcie and other netpbm applicationsHave to credit Alex van der Spek, zdoor@xs4all.nl , for linking me to these applications.
I used Ubuntu OS for this HOWTO.
Install netpbm from the netpbm site
./configure
make (make --keep-going if neccesary)
make package (make package --keep-going if neccesary)
./installnetpbm
Open a gnome terminal, at the command prompt type the commands proceeding each plot
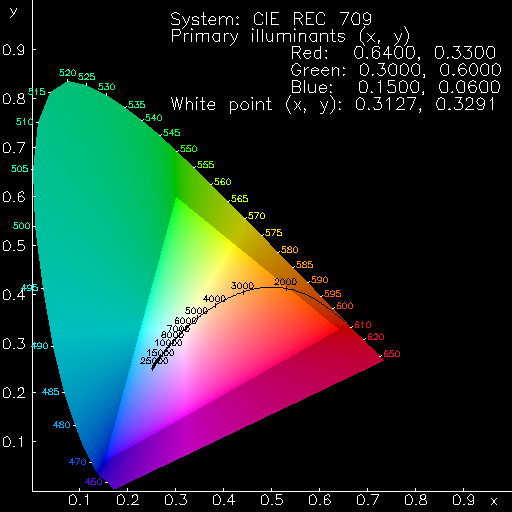
ppmcie > c_ppmcie.ppm
Open an image editor like get or use a netpbm convertor to get a png file from the ppm file for the web.
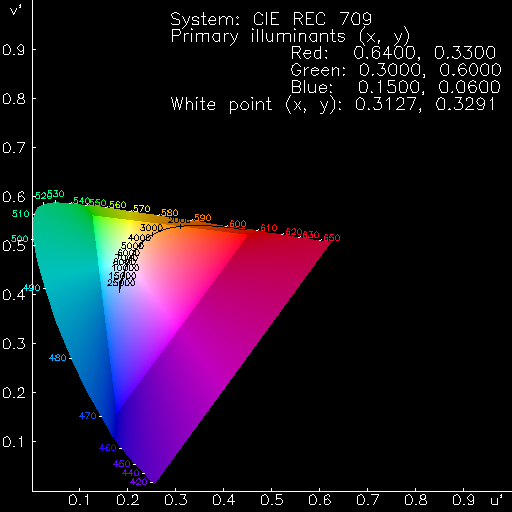
ppmcie -upvp > c_ppmcie.ppm
Open an image editor like gimp. or use a netpbm convertor to get a png file from the ppm file for the web.