gnuplot
gawk
You might be able to install gawk and gnuplot from your OS distribution. I used Ubuntu OS for this HOWTO, this also means the csv,txt,m and gnuplot files only have linefeeds and not carriage returns, use an appropriate text editor
XYZ tristimulus values can also be found at http://cvrl.ioo.ucl.ac.uk/cmfs.htm
The calculations from the CIE tristimulus data to CIE are from https://en.wikipedia.org/wiki/CIE_1931_color_space
You can download the all files from the following github to complete the HOWTO
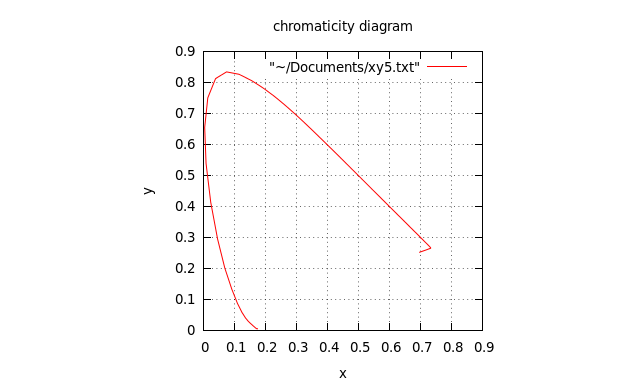
A chromaticity diagram is a uniform two dimensional color gamut at a specific level of light. These calculations are at 100% light but any level from 0-1 can be used in the specific program as long as they are used consistently throughout the process.
Calculate chromaticities from tristimulus values, x=X/(X+Y+Z), y=Y/(X+Y+Z). The text files to plot are linked, if there is a script to create a text file to plot if it is linked.
Open a gnome terminal, at the command prompt type the commands proceeding each plot
gnuplot
set mulitplot
set xrange [0:0.9]
set yrange [0:0.9]
set xlabel "x"
set ylabel "y"
set size square
plot "xy_data_in_visual_range.txt" with lines
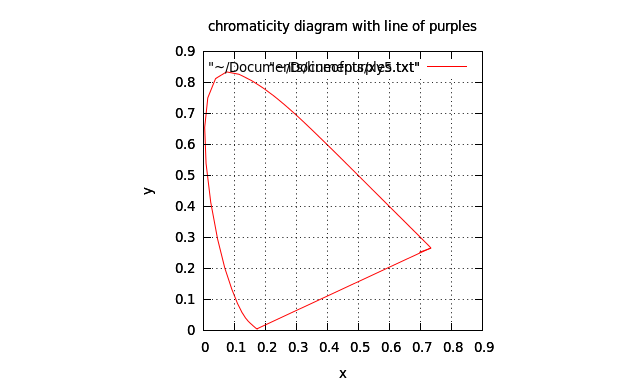
line_of_purples.txt
plot "line_of_purples.txt" with lines
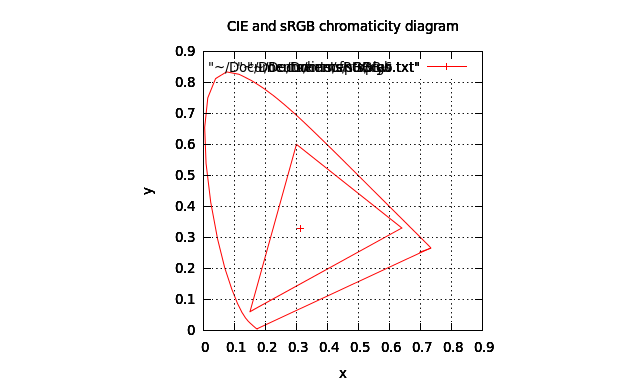
sRGB.txt
sRGB_white_point.txt
plot "sRGB.txt" with lines
plot "sRGB_white_point.txt"
Using Olaf Schultz's o.schultz@enhydralutris.de work, data and awk scripts.
You will have to quit gnuplot and run this awk program to create the CIEpoints, before adding the colored sRGB gamut to the appropriate plot above in multiplot, if you don't have awk, install gawk from your repository or https://www.gnu.org/software/gawk/
genCIEpoints.awk
gawk -f genCIEpointsRGB.awk -v d=5
plot "CIEpointsRGB.txt" u 1:2:10 w points pt 5 lc rgb variable
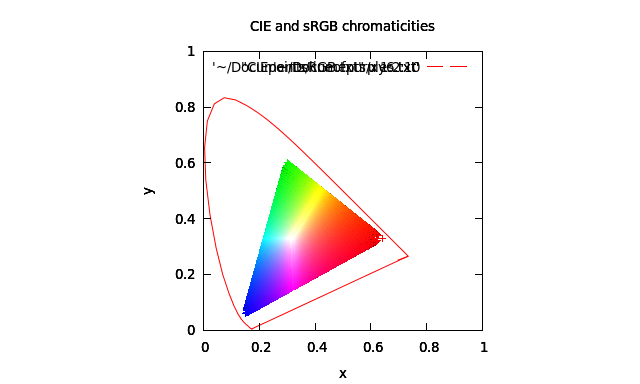
Using Olaf Schultz's o.schultz@enhydralutris.de work, data and awk scripts, I can get this far with just a few edits. You will have to quit gnuplot and run this awk program to create the CIEpoints, before doing the plot. You will need the following files to do the plot.
Border_ARGB98.txt
Border_CIERGBE.txt
Border_ColorMatch.txt
Border_ProFoto.txt
Border_sRGB.txt
CIE1964.txt
TempeKa.dat
CIE_all.gnuplot
gnuplot
load "CIE_all.gnuplot"
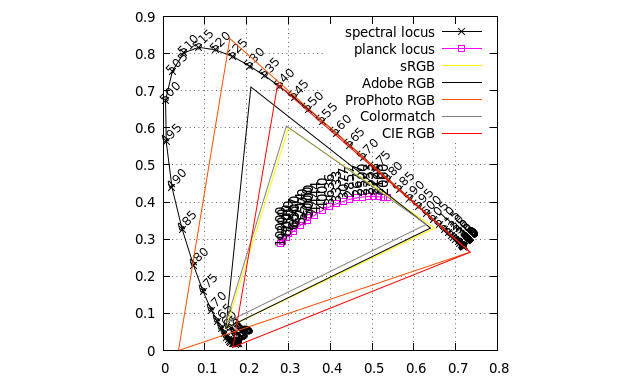
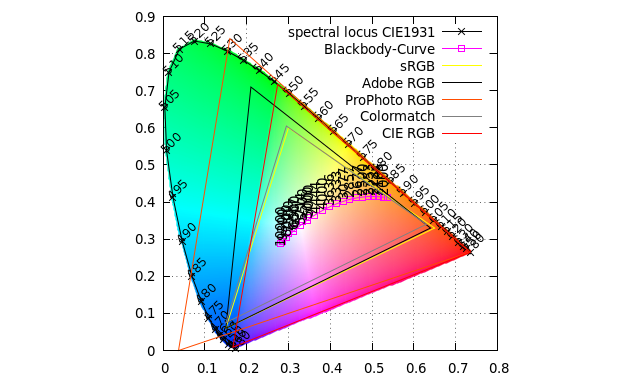
Using Olaf Schultz's o.schultz@enhydralutris.de work, data and awk scripts, I can get this far with just a few edits. You will have to quit gnuplot and run this awk program to create the CIEpoints, before doing the plot. You will need the following additional files in addition to the above files to do the plot.
plotting over the whole eye's gamut using a device gamut less than the eye's will produce wrong values, device to device repurposing within the eye's gamut is a better approximation, but here it is
CIE_all2.gnuplot
CIE_1931.txt
genCIEpoints_overxy.awk
gawk -f genCIEpoints_overxy.awk -v d=0.0025 -v Y=1.0 -v gam=0.454545
gnuplot
load "CIE_all2.gnuplot"