You might be able to install octave and gnuplot from your OS distribution. I used Ubuntu OS for this HOWTO, this also means the csv,txt,m and gnuplot files only have linefeeds and not carriage returns, use an appropriate text editor
A chromaticity diagram is a uniform two dimensional color gamut at a specific level of light. These calculations are at 100% light but any level from 0-1 can be used in the specific program as long as they are used consistently throughout the process.
XYZ tristimulus values can be found at http://cvrl.ioo.ucl.ac.uk/cmfs.htm
The CIE calculations and RGB color space primaries/calculations are from https://en.wikipedia.org/
Some basic concepts and planckian white point chromaticities from Olaf Schultz's o.schultz@enhydralutris.de awk work http://www.enhydralutris.de/Diverses/plotCIEwithGnuplot.tgz also found down further on my main page
You can download all the files from the following github to complete the HOWTO
Most of the u'v' octave scripts are named the same as the xy ones, I didn't update the variable names inside them either yet
Open a terminal, at the command prompt type octave and the following instructions
octave
octave:1>XYZ_to_xy;
Open another terminal, at the command prompt type the commands
gnuplot
gnuplot>load "visual_upvp_locus.gnuplot"
gnuplot>load "visual_upvp_locus_and_line_of_purples.gnuplot"

gnuplot>load "visual_upvp_locus_and_line_of_purples_labels_planck.gnuplot"

gnuplot>load "visual_upvp_locus_and_line_of_purples_labels_planck_spaces.gnuplot"

octave>XYZ = xy_to_XYZ_points(1);
octave>RGBlinear = XYZ_to_RGBlinear_points(XYZ);
octave>RGB = RGBlinear_to_RGB_points(RGBlinear);
octave>RGBintegers = RGB_to_RGBintegers_points(RGB);
octave>RGBhex = RGBintegers_to_RGBhex_and_upvp_points(RGBintegers);
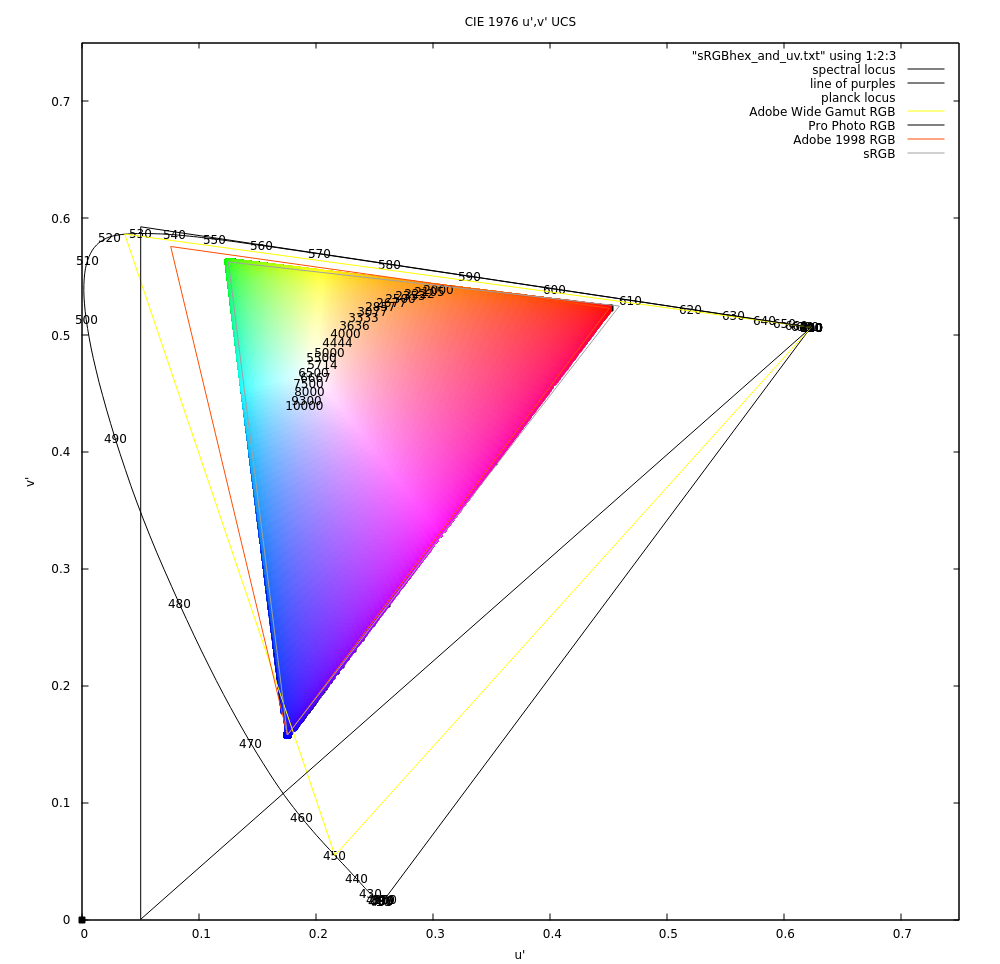
gnuplot>load "visual_xy_locus_and_line_of_purples_labels_planck_spaces_sRGB_color.gnuplot"

The primary corners and neutral axes didn't seem visually pure and weren't in gimp image editor, here is the reverse calculation and plot, they look like they are supposed to compared to others I have seen. I don't know why the forward calculations don't, maybe I didn't adjust XYZ for white point before the forward calculations, you'll have to switch to the reverse_uv directory.
octave>makeRGB();
octave>RGB_to_rgb();
octave>rgb_to_rgbLinear();
octave>rgbLinear_to_XYZ();
octave>XYZ_to_uv();
octave>uv_and_RGBhex();
gnuplot>load "reverse_uv_sRGB.gnuplot";