You might be able to install gawk and gnuplot from your OS distribution. I used Ubuntu OS for this HOWTO, this also means the csv,txt,m and gnuplot files only have linefeeds and not carriage returns, use an appropriate text editor
XYZ tristimulus values can be found at http://cvrl.ioo.ucl.ac.uk/cmfs.htm
The calculations from the CIE tristimulus data to CIELUV are from https://en.wikipedia.org/wiki/CIELUV
You can download the all files from the following github to complete the HOWTO
A chromaticity diagram is a uniform two dimensional color gamut at a specific level of light. These calculations are at 100% light but any level from 0-1 can be used in the specific program as long as they are used consistently throughout the process.
Calculate chromaticities from tristimulus values, up=4*X/(X+15*Y+3*Z), vp=9*Y/(X+15*Y+3*Z). u'v' chromaticities are more uniform than x,y, practically I don't know if it matters. CIELUV derived from u'v'L also has a saturation correlate. All the specific files you will need are in gnuplot_upvp_chromaticities.tar.gz credits to Olaf Schultz's o.schultz@enhydralutris.de work http://www.enhydralutris.de/Diverses/plotCIEwithGnuplot.tgz
Open a gnome terminal, at the command prompt type the commands proceeding each plot
gnuplot
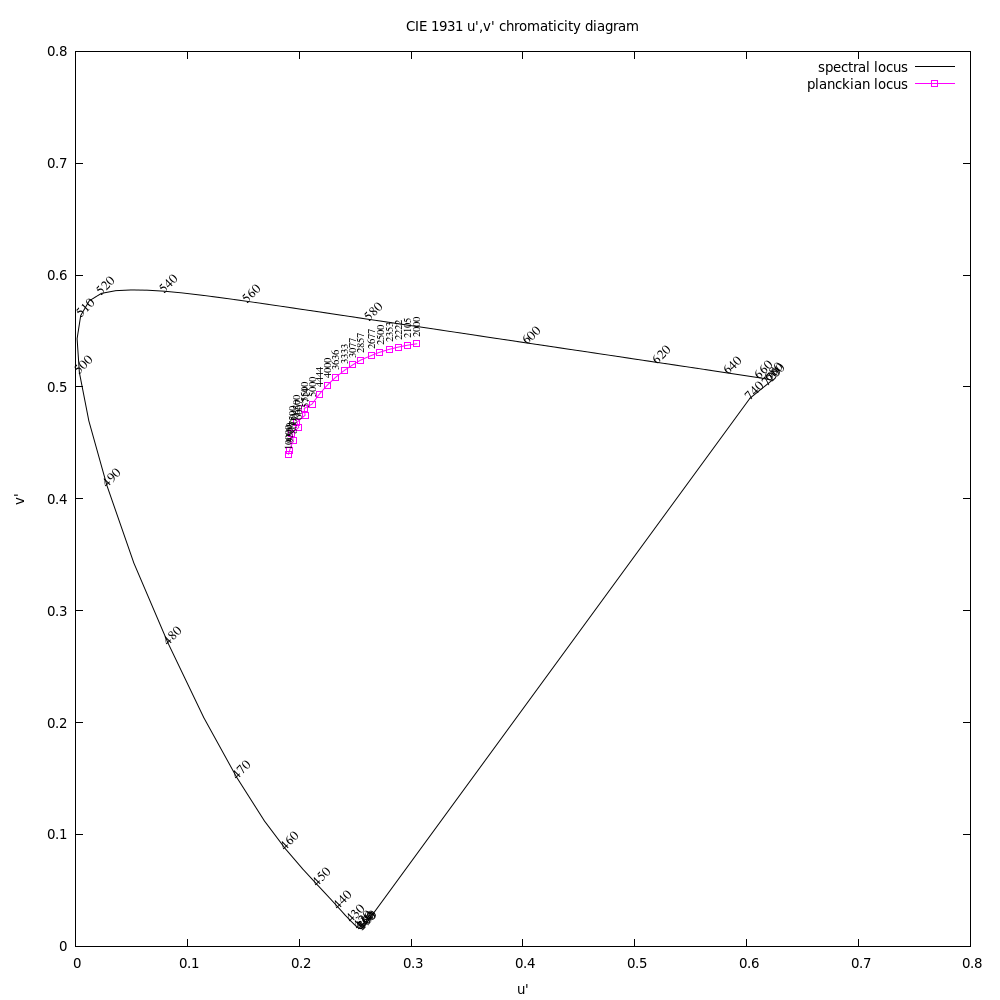
load "upvp_spectral_locus.gnuplot"
gnuplot
load "upvp_all.gnuplot"

I know I have errors in here I have to fix.
gawk -f gen_uv_CIEpoints_sRGB.awk -v d=5
gnuplot
load "upvp_all_sRGBpoints.gnuplot"
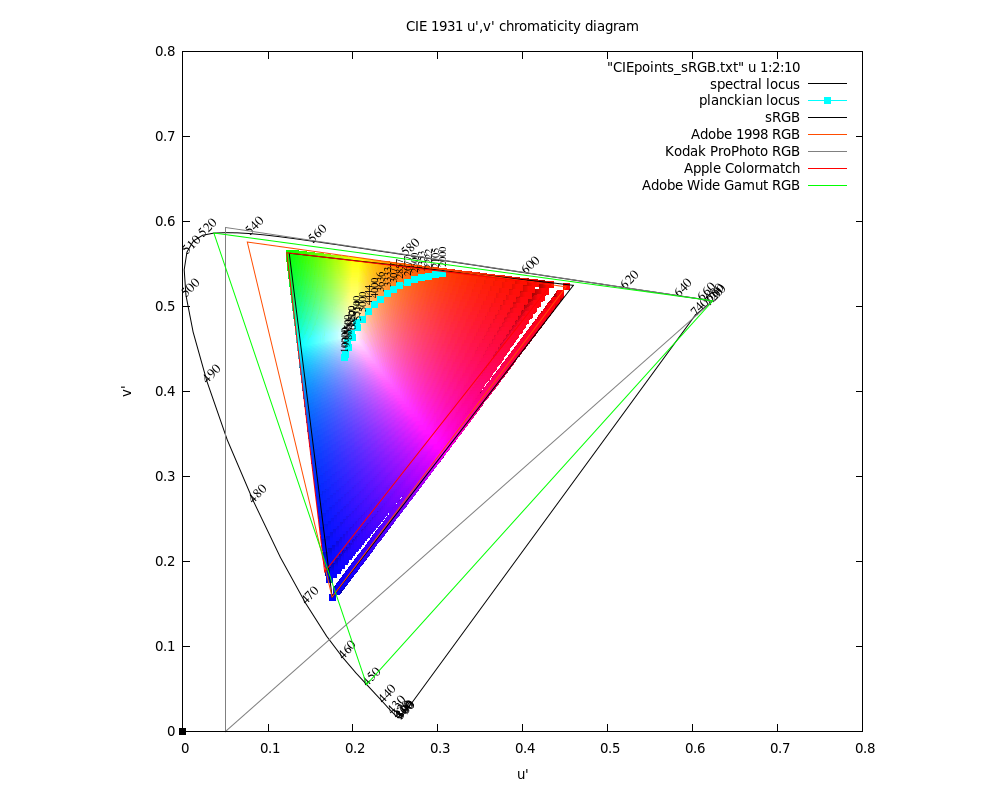
plotting over the whole eye's gamut using a device gamut less than the eye's will produce wrong values, device to device repurposing within the eye's gamut is a better approximation, but here it is
I know I have other errors in here I have to fix.
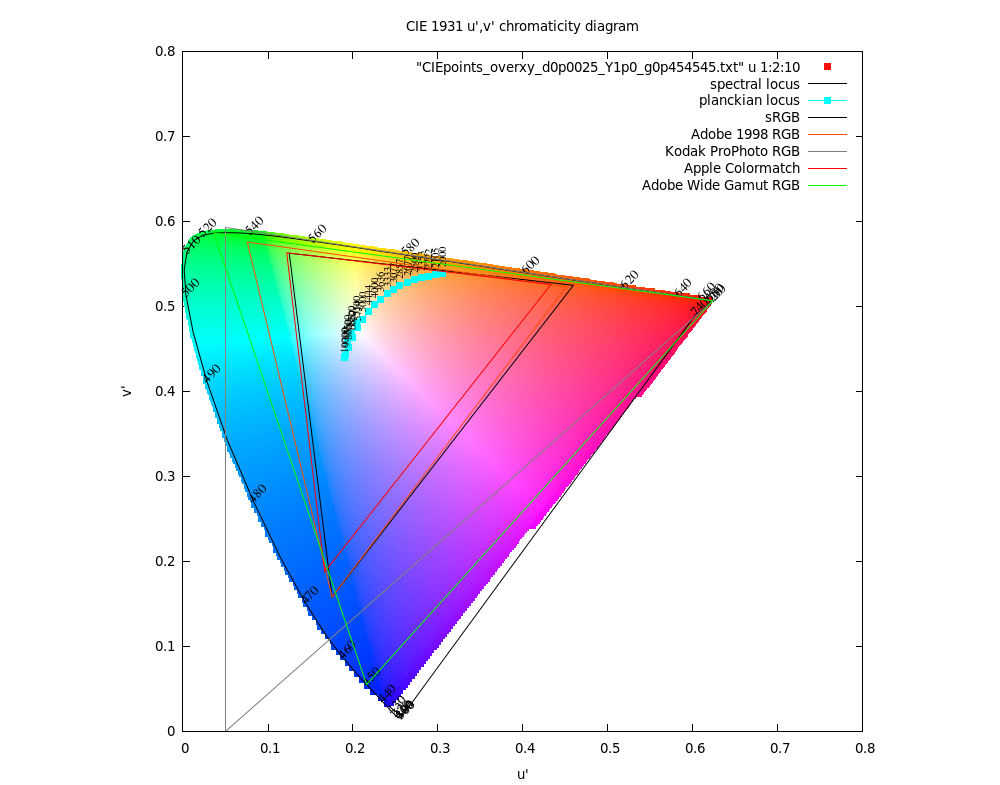
gawk -f genCIEpoints_overuv.awk -v d=0.0025 -v Y=1.0 -v gam=0.454545
gnuplot
load "upvp_all_CIE_locus.gnuplot"